
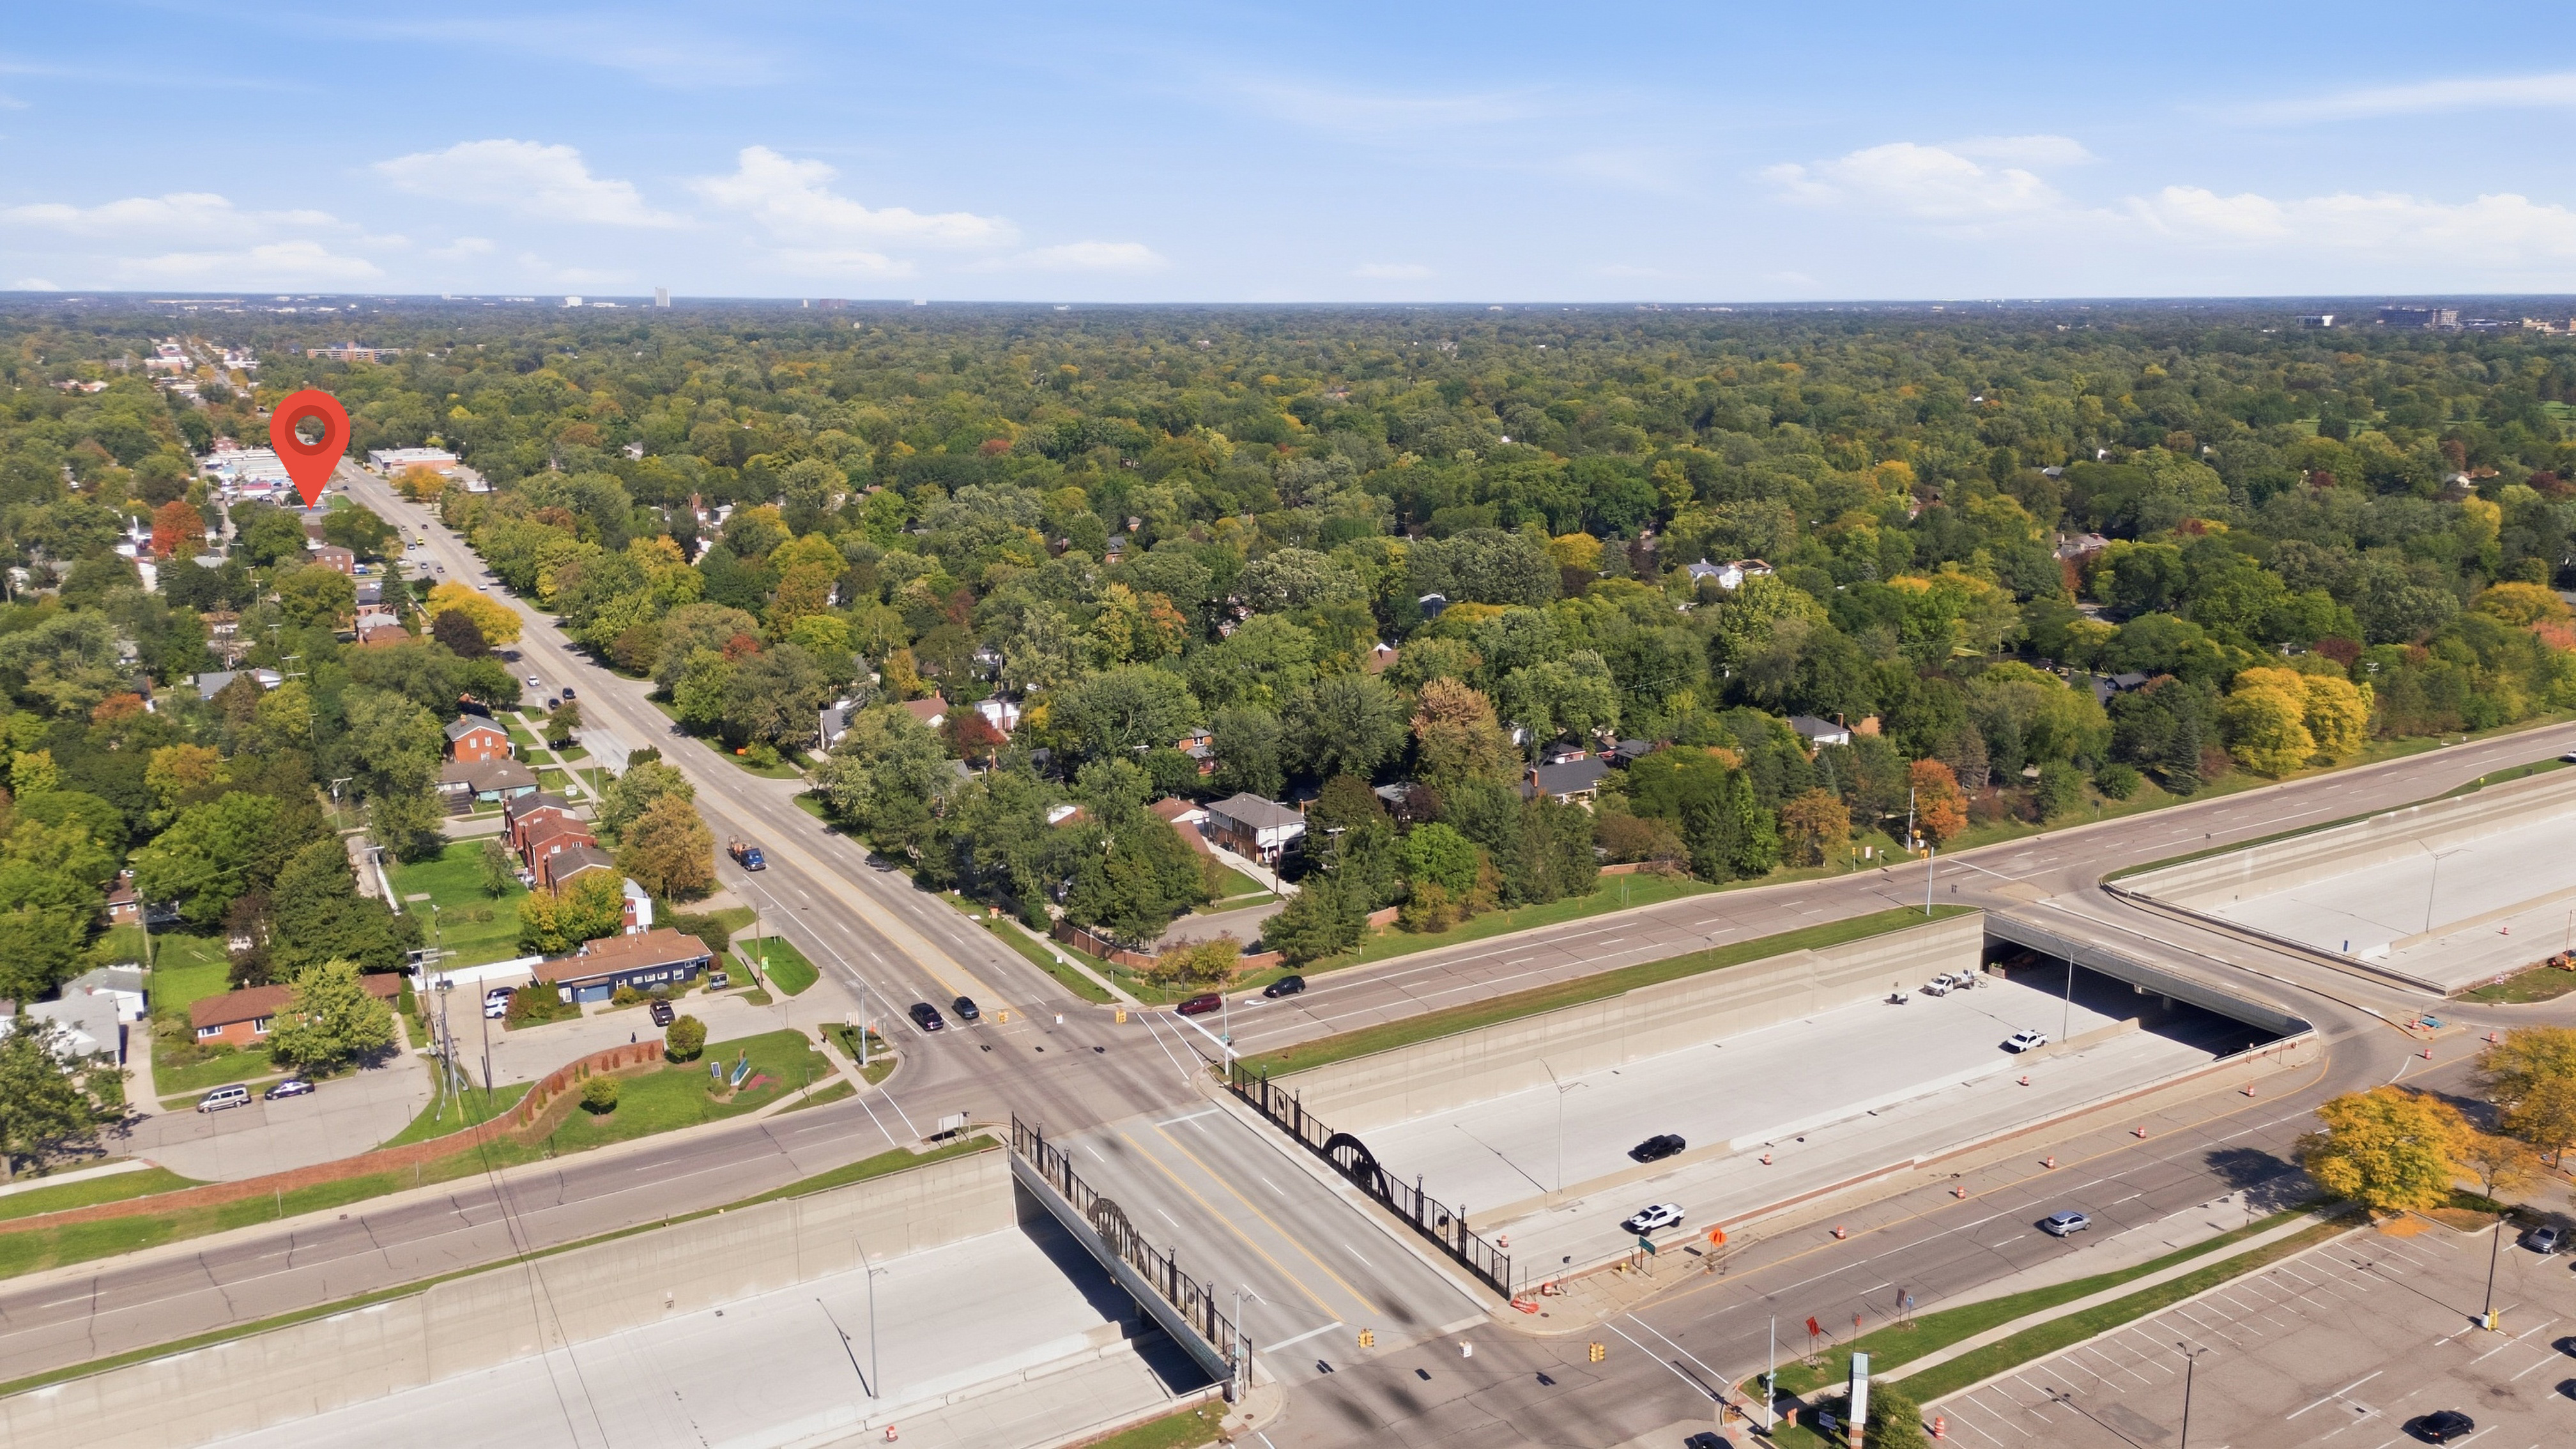
Traffic Report
A four- to five-page PDF on a commercial property’s location: how many cars pass it each day, who lives and works nearby, and what is around it. Every figure comes from a public source, named on the page.
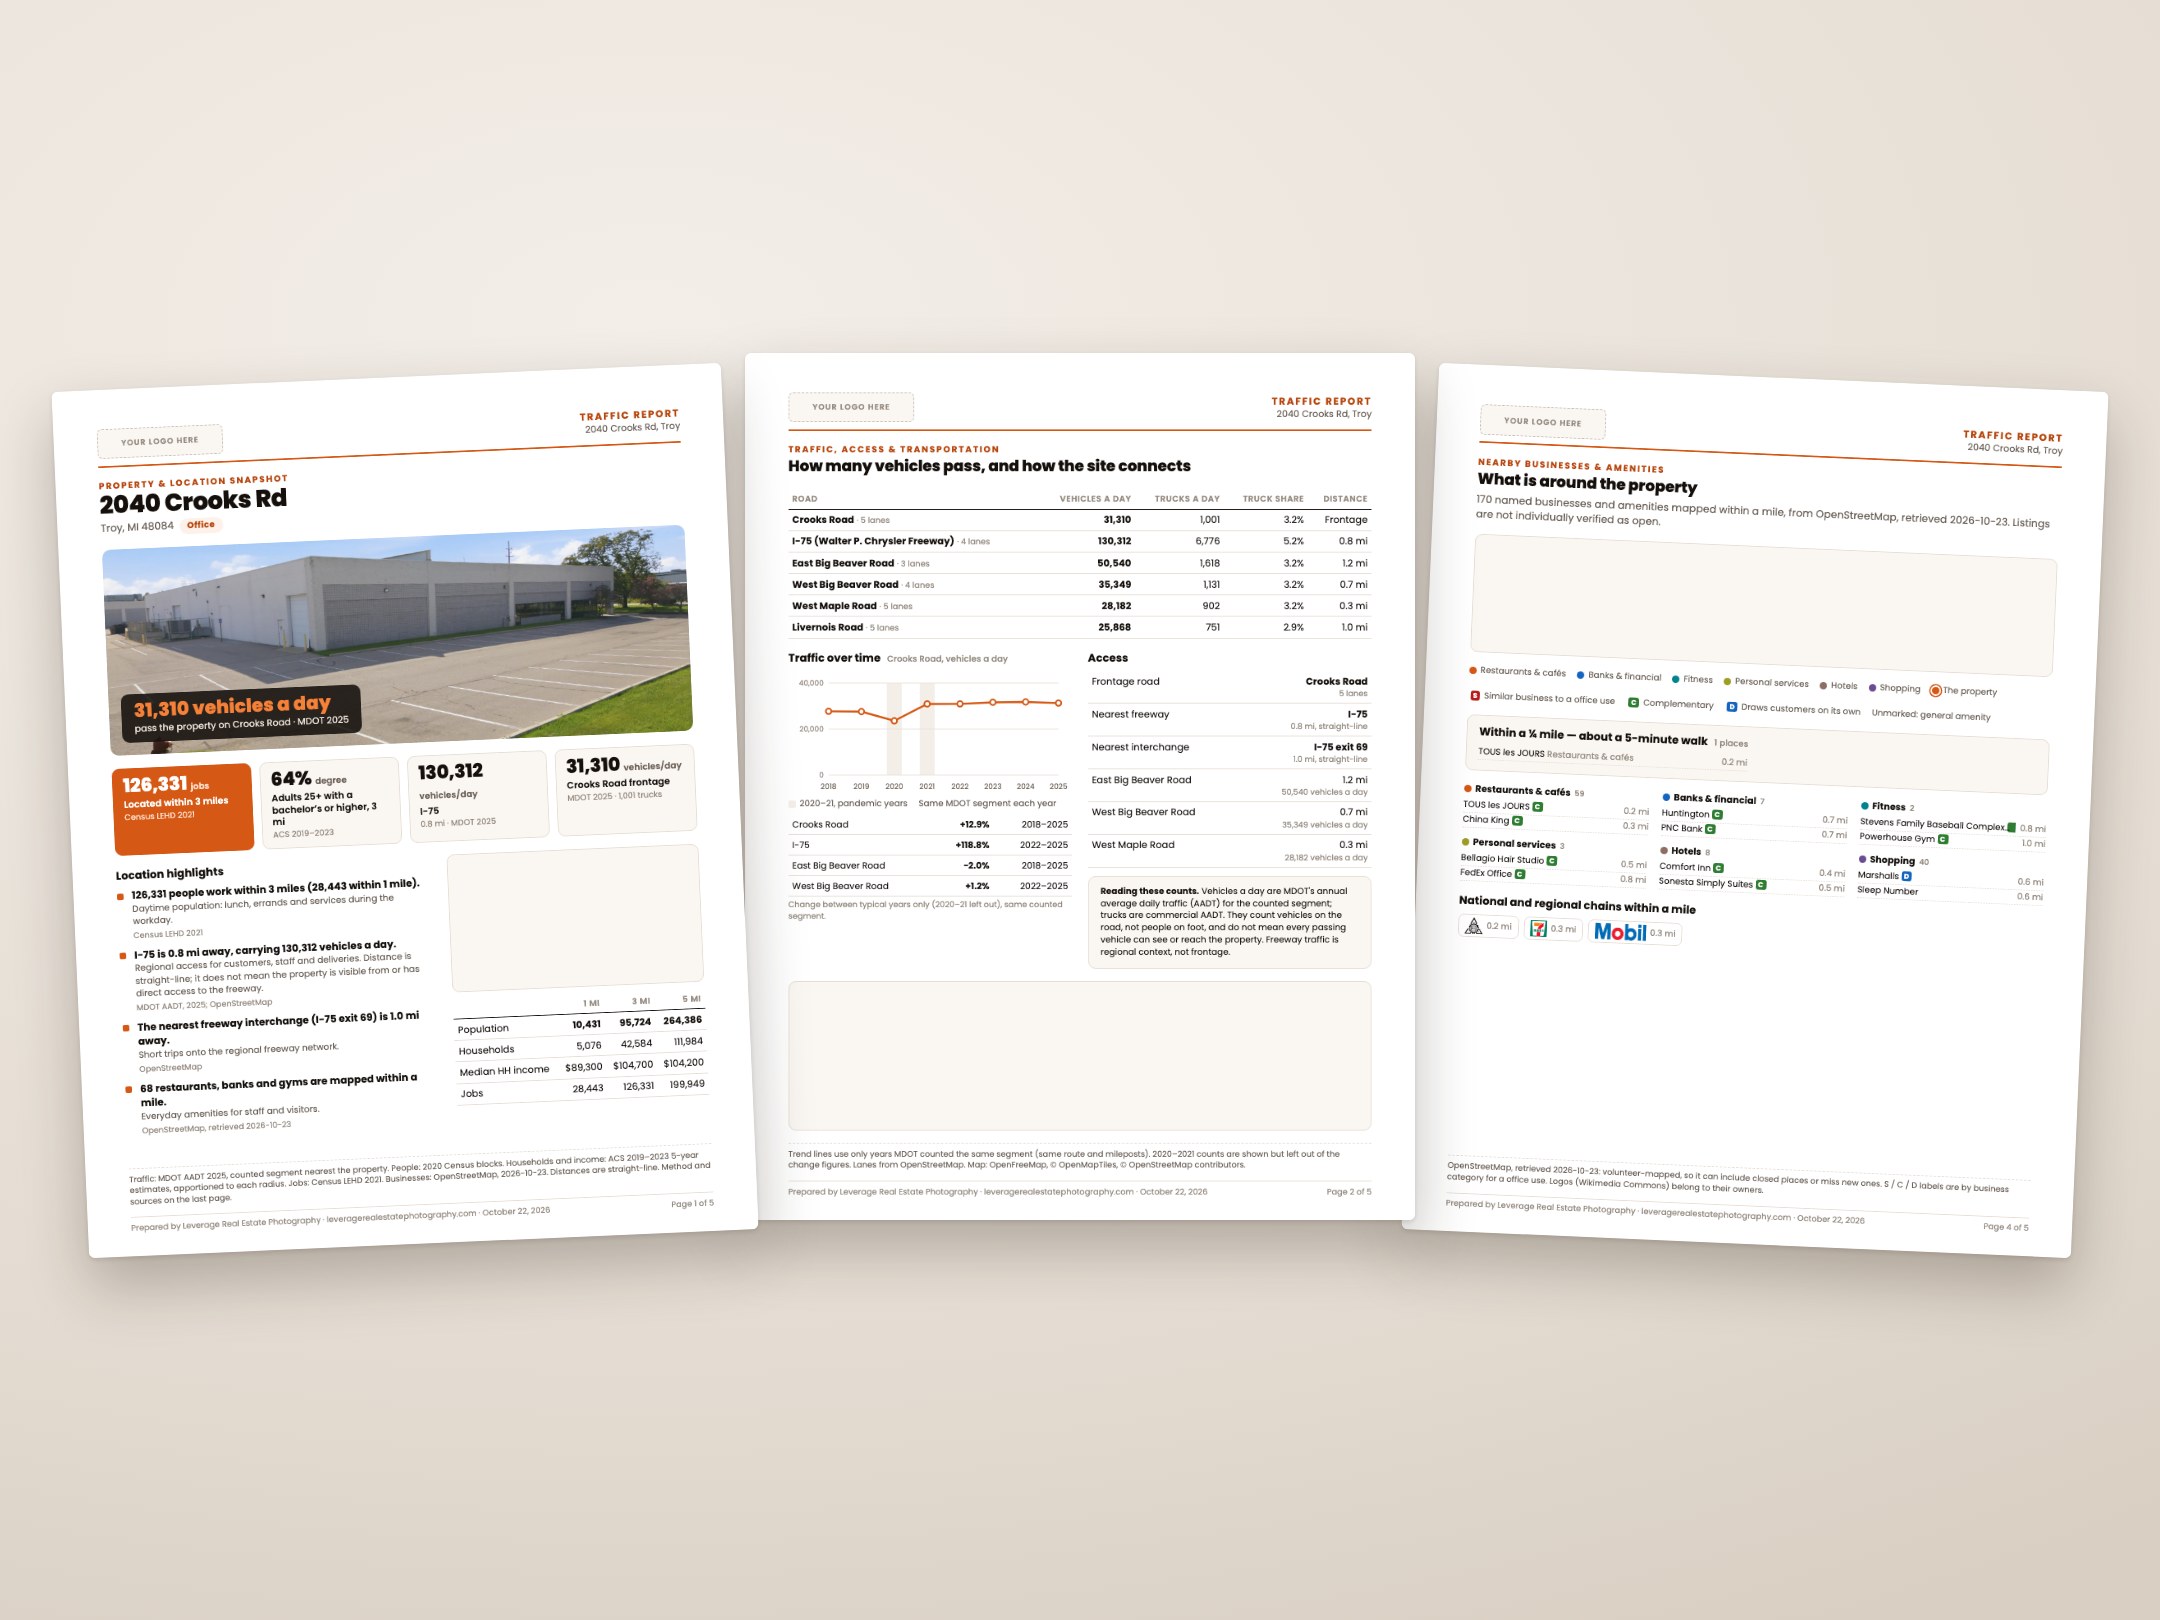
The location, in numbers
Attach it to the listing, send it to a tenant, or bring it to the showing. It covers what a buyer or tenant asks about a location before they ask to see the building:
- Cars per day on the frontage road and the nearby freeways, from MDOT’s counts, with how they have changed over the years MDOT has counted the same stretch of road
- Access: the distance to the nearest freeway and interchange
- People nearby: population and how it has grown, households, income, age and education within 1, 3 and 5 miles
- Jobs nearby: how many people work within 1, 3 and 5 miles, and in which industries
- Businesses nearby: national chains and local businesses within a mile, on a map
- A summary page of what the numbers mean for this property
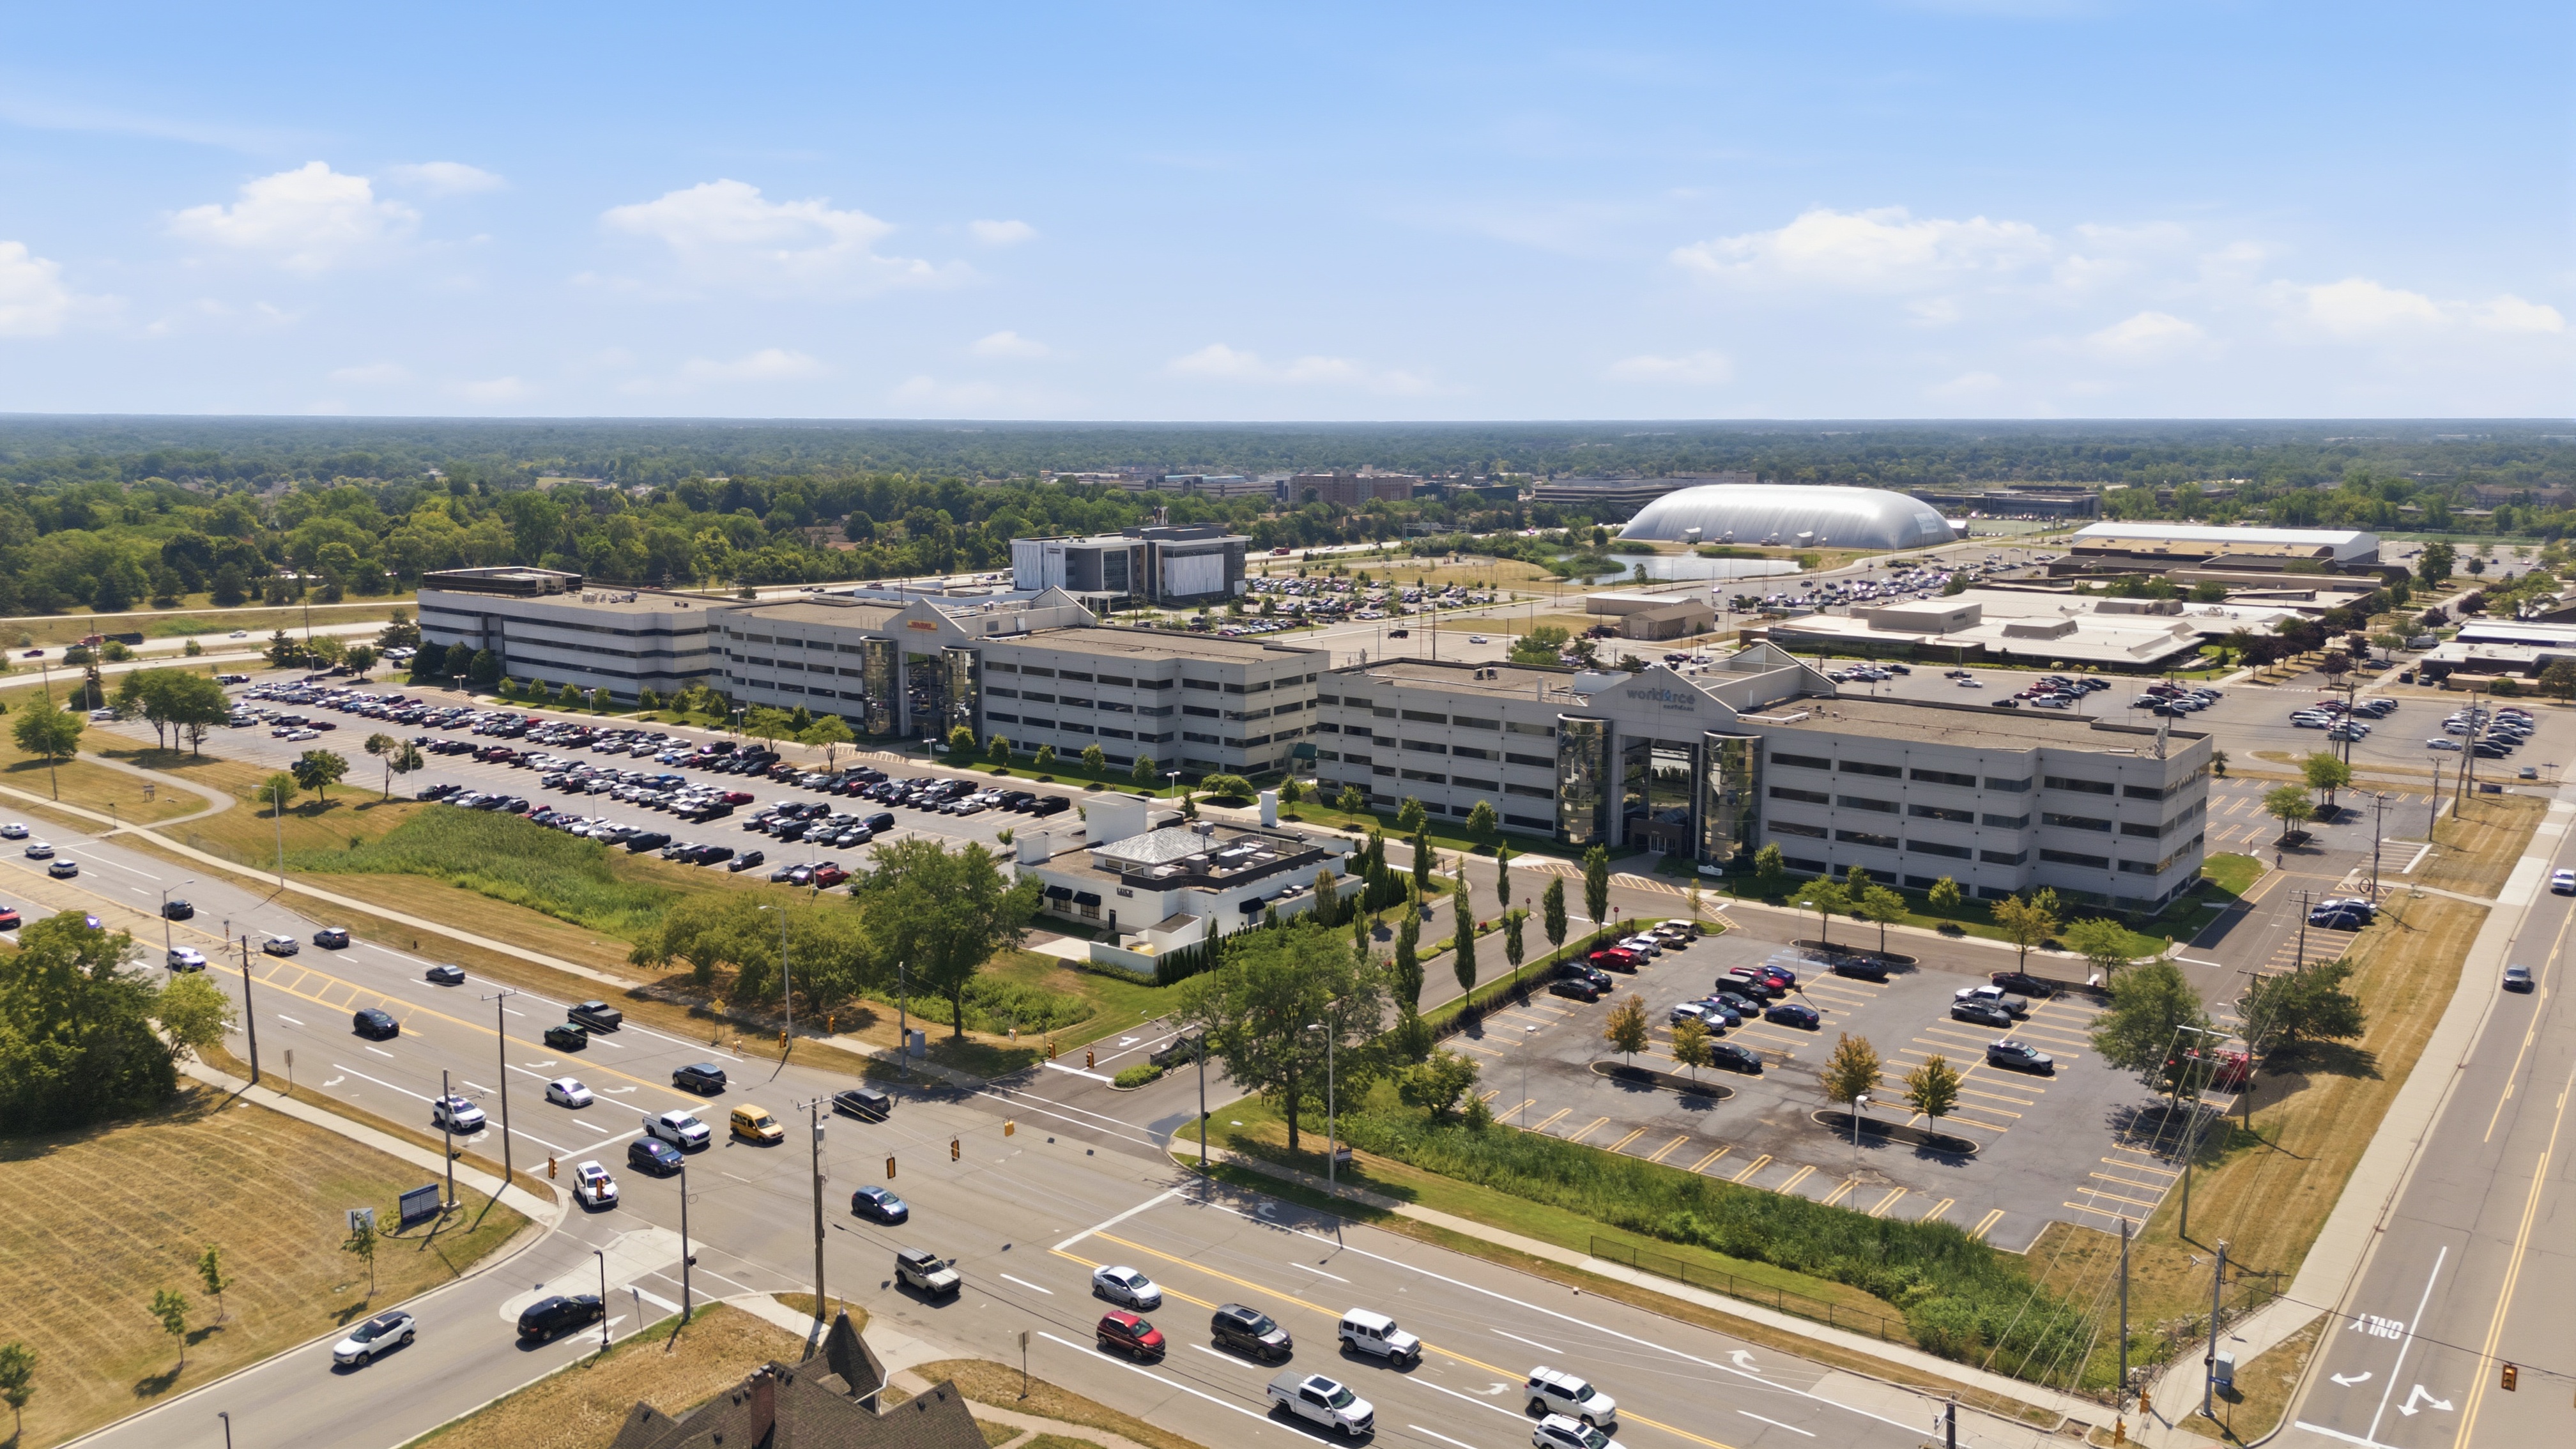
A retail report leads with different numbers than an office report
The report is set to the property type, and that decides which numbers go first. Here is what each of our example reports leads with:
- Retail (Oak Park): 20,475 vehicles a day on the Coolidge Highway frontage, and 138,503 people living within 3 miles
- Office (Troy): 126,331 jobs within 3 miles, and 64% of adults there with a bachelor’s degree or higher
- Medical (Northville): 74,404 people living within 3 miles, 22% of them 65 or older
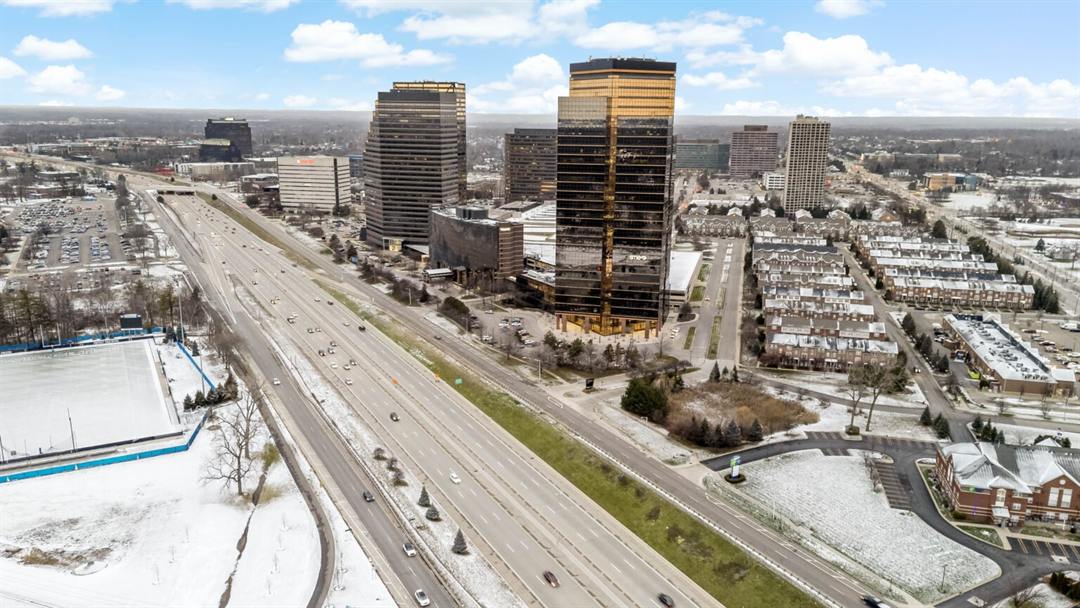
- Industrial (Southfield): 123,923 vehicles a day on I-696, and 0.4 miles to I-696 exit 7
- Land (Ann Arbor): the population within 3 miles is up 9.8%, and the number of homes up 7.1%
Public sources, named on every page
Nothing in the report is an estimate we made up or a score we invented. Each number is shown with its source and its year:
- Traffic counts: the Michigan Department of Transportation’s annual average daily traffic (AADT) for each counted road segment
- Population and housing: the 2020 and 2010 US Census, counted block by block inside each radius
- Income, age, education: the US Census American Community Survey 5-year estimates
- Jobs: the US Census LEHD workplace data (where people work, by industry)
- Businesses: OpenStreetMap, with the date it was checked. Places that have closed are taken off before the report goes out
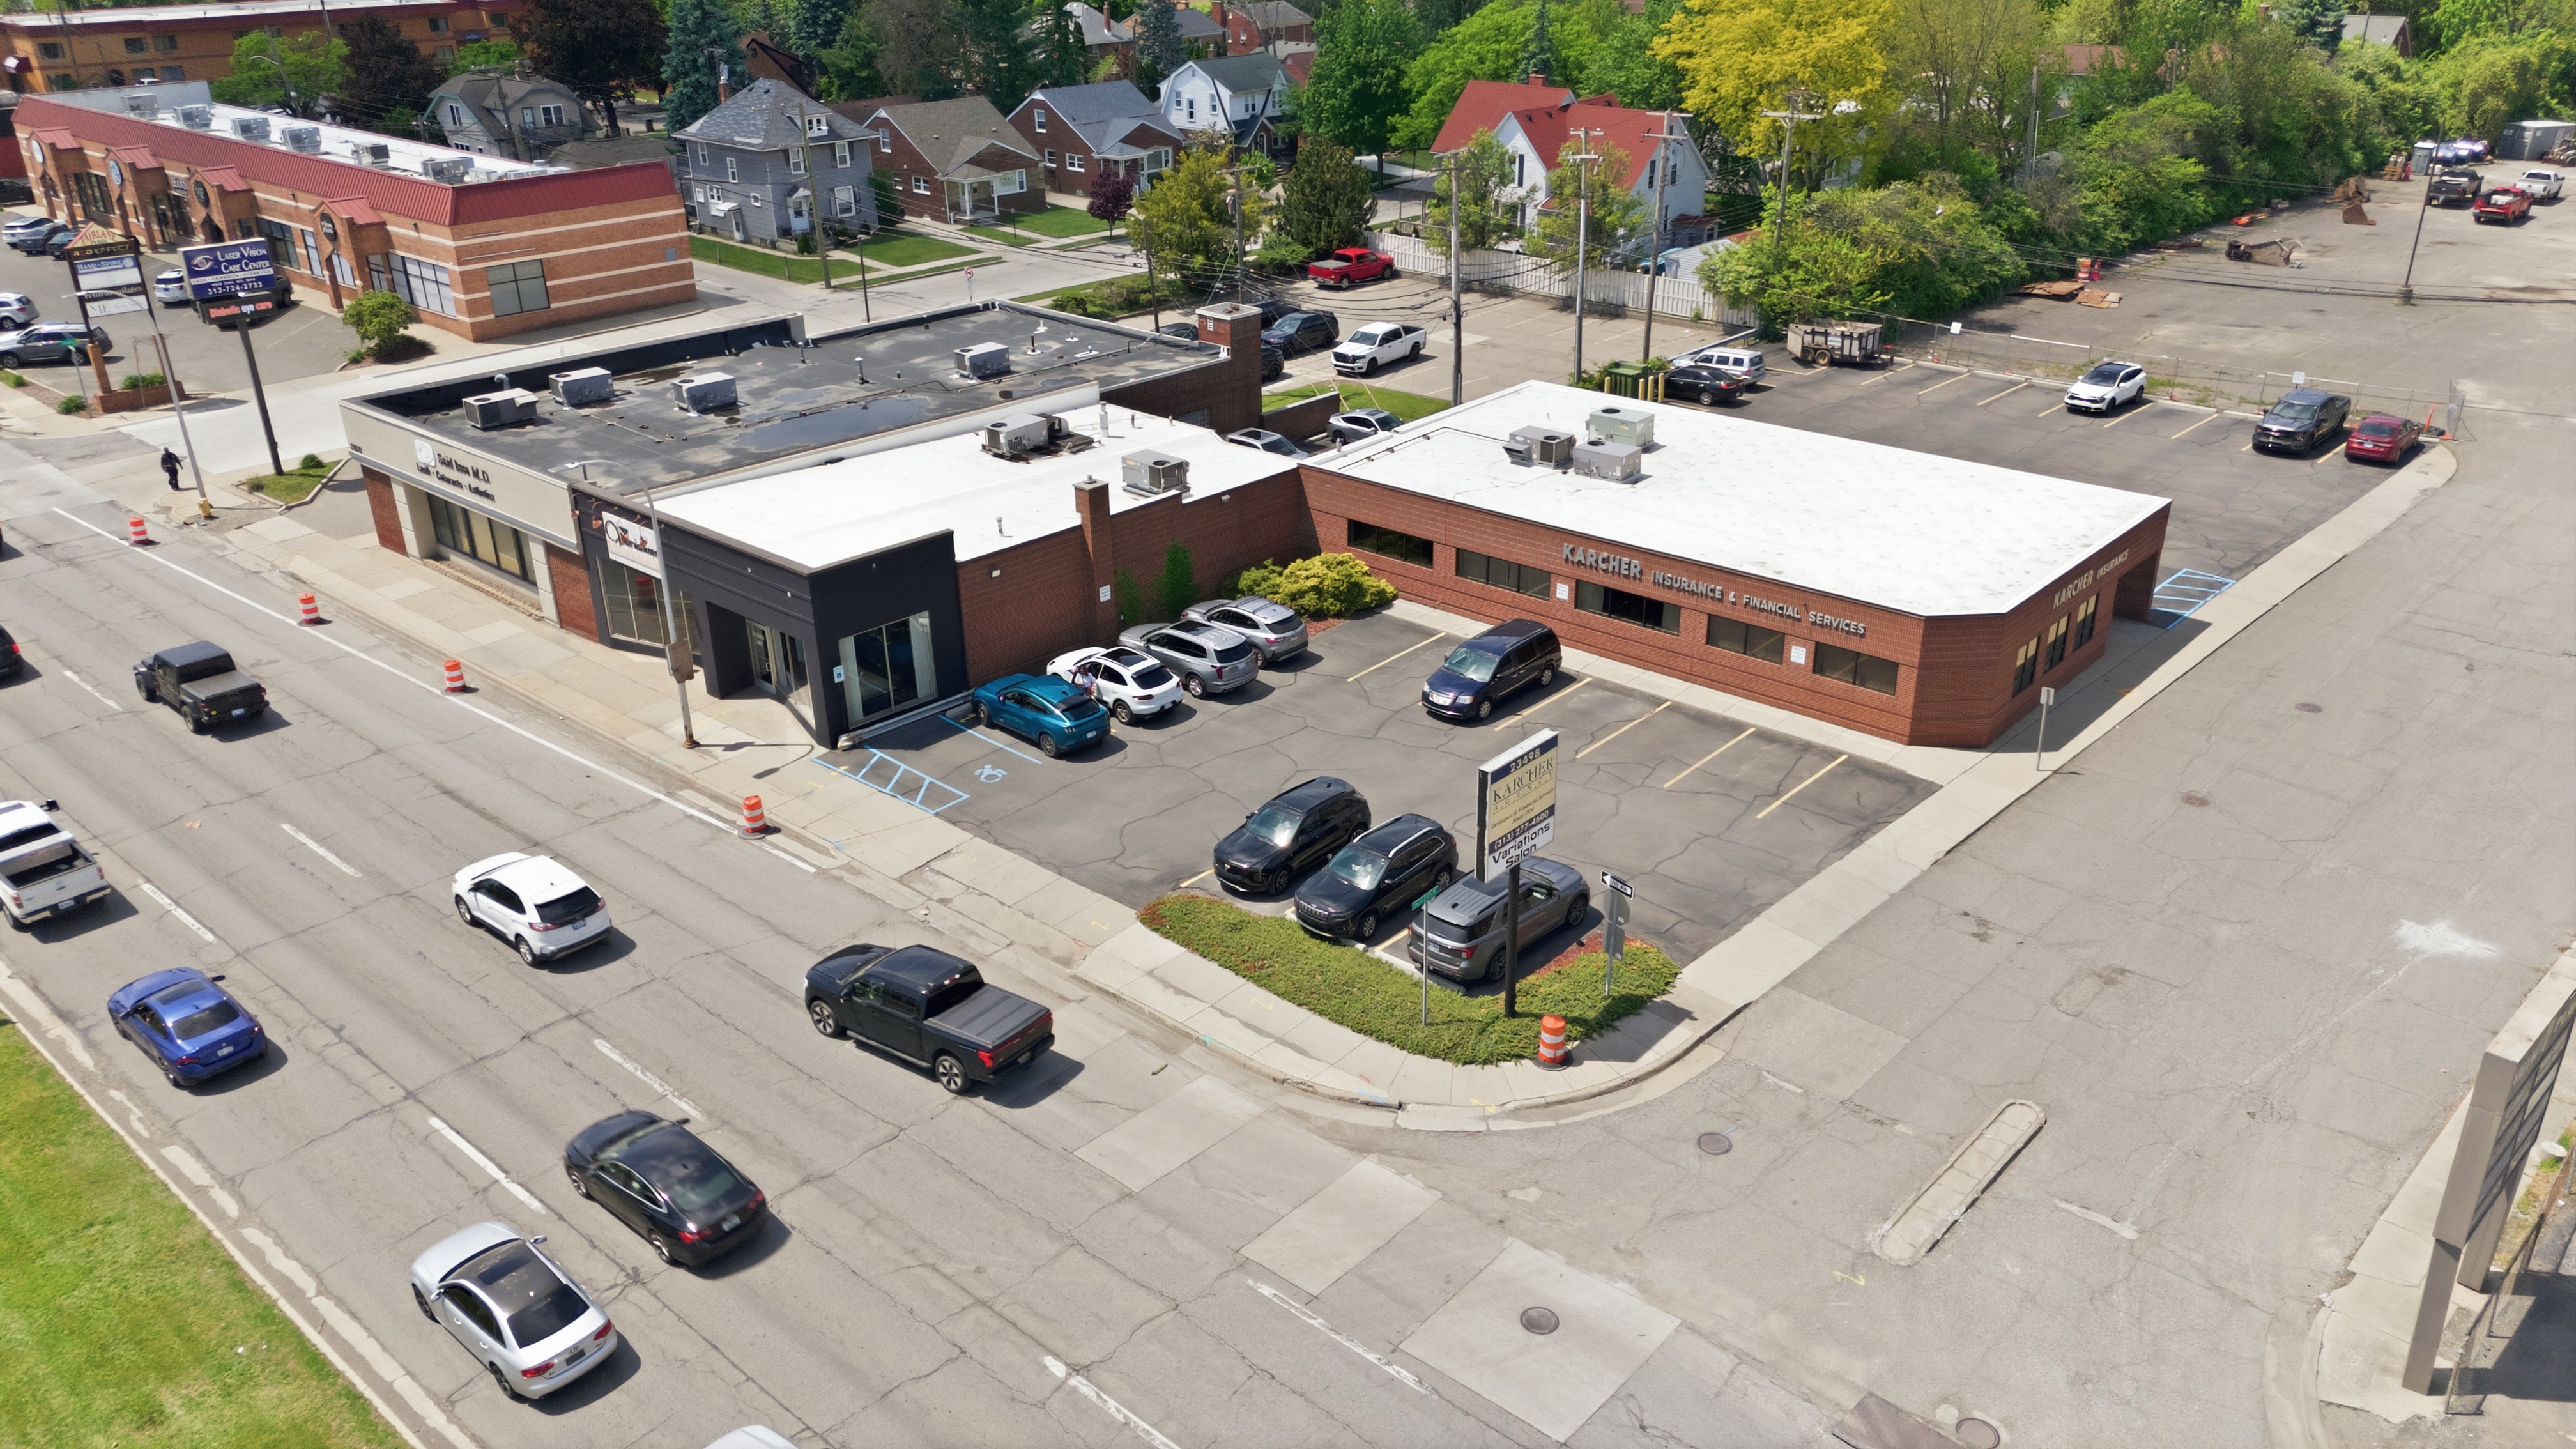
The report and the road, side by side
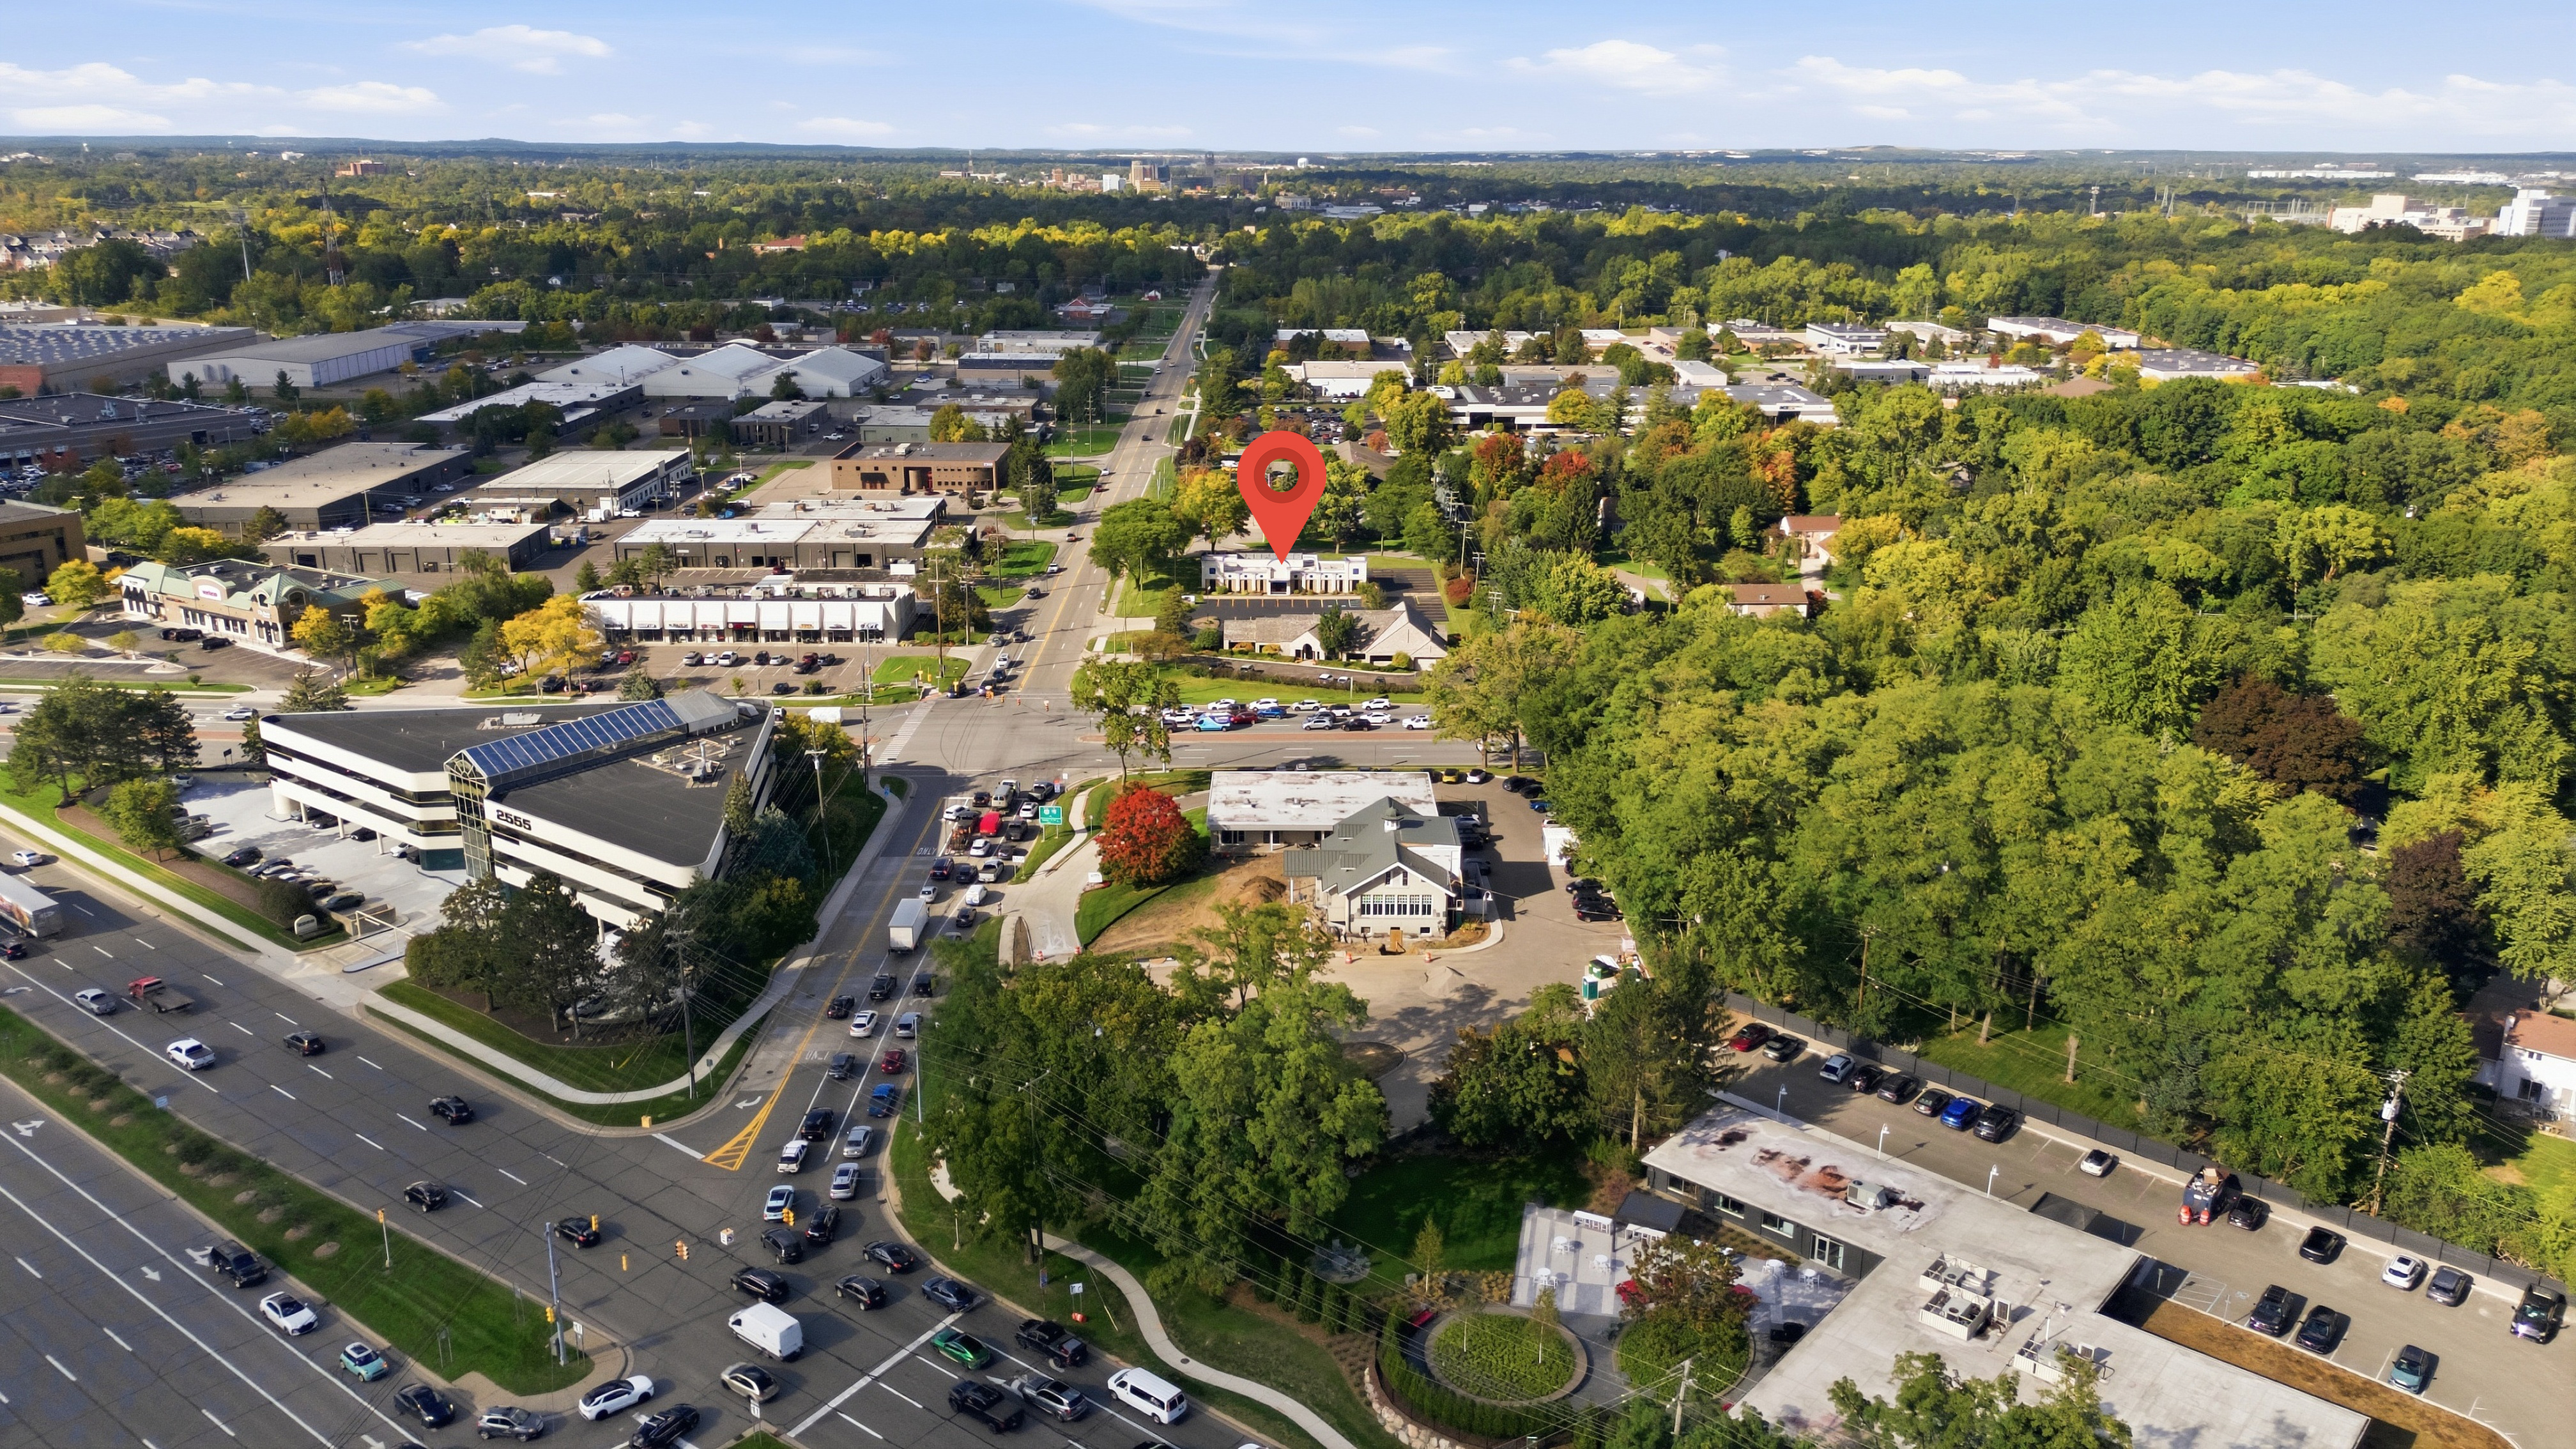
The report comes with the Premium and Exclusive commercial packages, alongside the photos, drone and our rush hour shots of the road out front. The numbers say how busy the road is; the photos show it.
What agents say
“If I could, I would have given them 10 stars.”
Agents we shoot for work at
Frequently asked questions
What is a Traffic Report?
A four- to five-page PDF on a commercial property’s location: daily traffic counts on the frontage road and nearby freeways (MDOT), distance to the nearest freeway interchange, population, income and jobs within 1, 3 and 5 miles (US Census), the businesses within a mile, and a summary of what the numbers mean for the property type.
Where do the traffic counts come from?
From the Michigan Department of Transportation, which publishes an annual average daily traffic (AADT) count for each counted road segment. The report shows the most recent year MDOT has published for the road in front of the property, the year it is from, and earlier years where MDOT counted the same stretch.
Which property types does it cover?
Retail, restaurant, office, medical, industrial, flex, land and mixed use. The property type decides which numbers lead: a retail report starts with traffic and households nearby, an office report with jobs and education, an industrial report with freeway access.
How do I get one?
It comes with the Premium and Exclusive commercial packages. Book a commercial shoot and the report is delivered with the photos.
Can I put it in the listing?
Yes. It is yours to attach to the listing, send to tenants and buyers, or print for a showing.
Can it carry my logo?
Yes. Send us your logo and it goes at the top of every page, so the report goes out under your name. Without one, that space reads “Your logo here”.
How accurate are the nearby businesses?
Businesses come from OpenStreetMap, which is kept up to date by volunteers. National chains are well covered; small local businesses less so. The report shows the date the list was checked, and any place that has closed is taken off before it goes out.
Get a Traffic Report with your commercial shoot
Send us the address and the property type, and we will put the shoot and the report together.